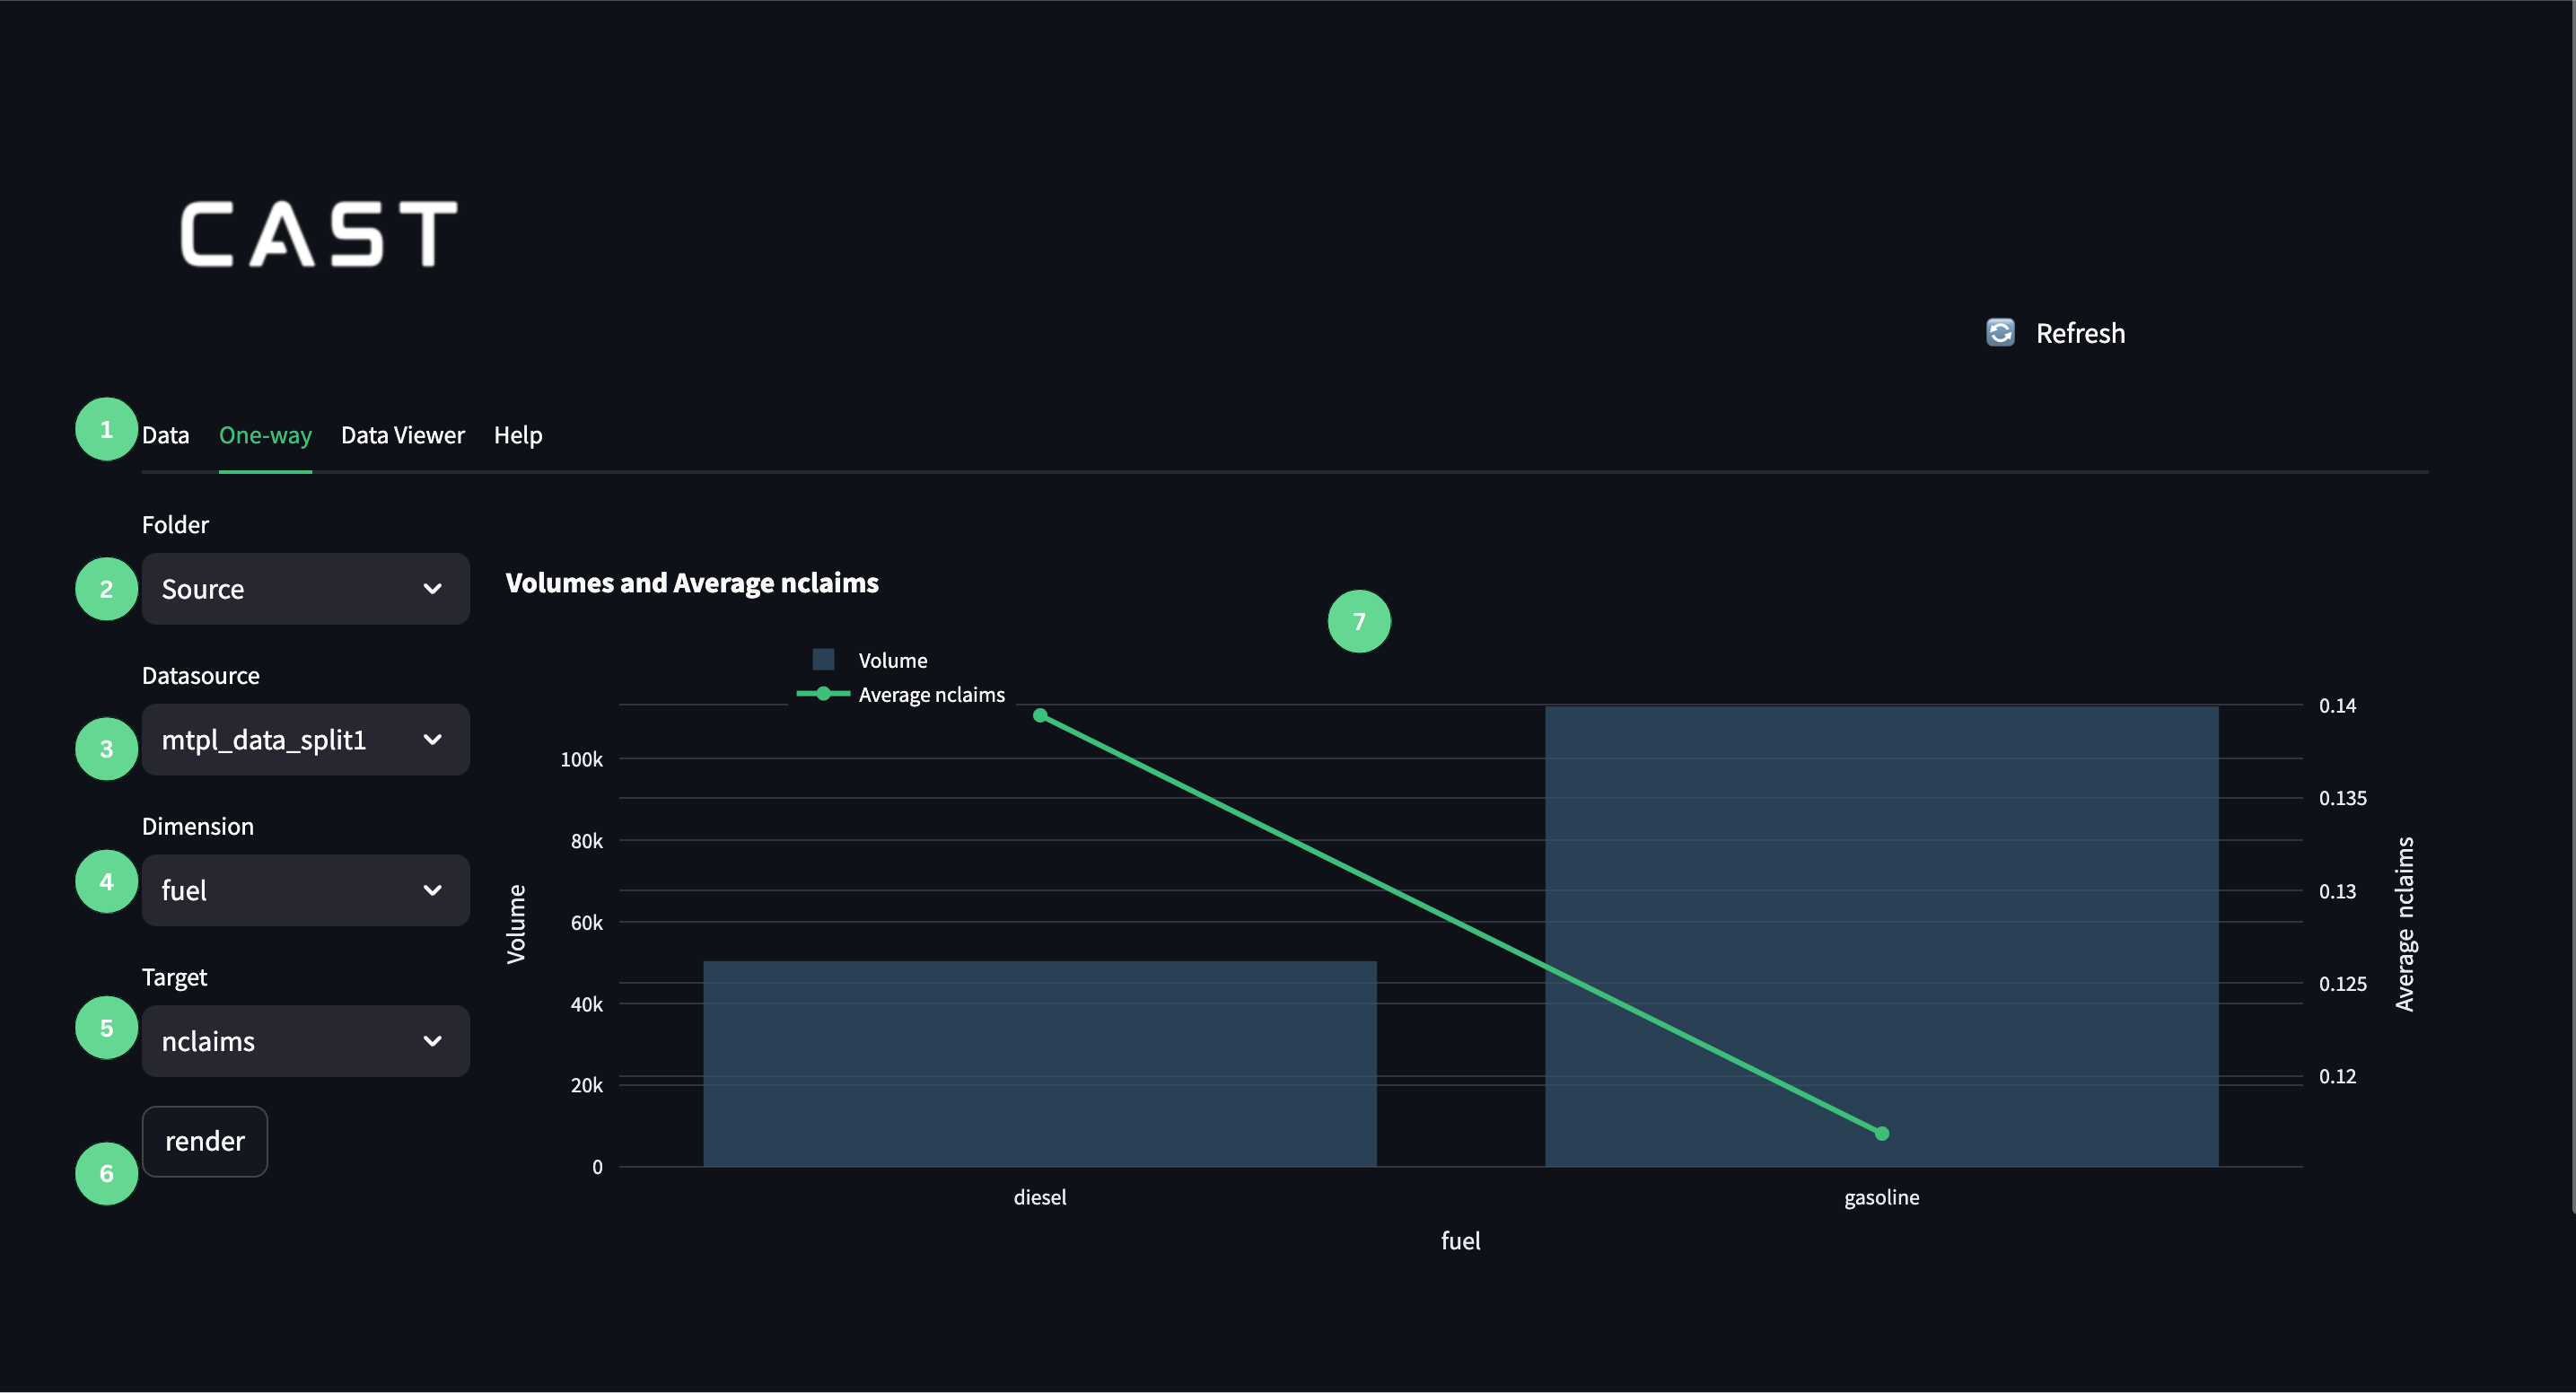
- One-way tab that opens the one way visualisation viewer.
- The Folder dropdown list where you can choose which folder they would like to choose a dataset from.
- The Datasource dropdown list where you can choose which datasource you would like to build one-way visualisations from.
- The Dimension dropdown list where you can use the column in the chosen dataset that will be visualised on the x-axis of the one-way visualisation.
- The Target dropdown list where you can choose the column in the chosen dataset that will be visualised on the secondary y-axis.
- The render button will render the one-way visualisation once all the above parameters have been selected.
- The one-way visualisation where you can do checks and inspect the selected data.
User Guide
Step 1
- Select the Folder and Data Source from which you would like to build the one-way visualisation.
Step 2
- Select the Dimension (x-axis) and Target (y-axis) that you would like to by visualised.
Step 3
- Render and Inspect the visualisation
Step 4
- Repeat steps 2 and 3 in order to check each column.