> ## Documentation Index
> Fetch the complete documentation index at: https://cast.exakt.ai/llms.txt
> Use this file to discover all available pages before exploring further.
# Data viewer
> How to run queries on your own data
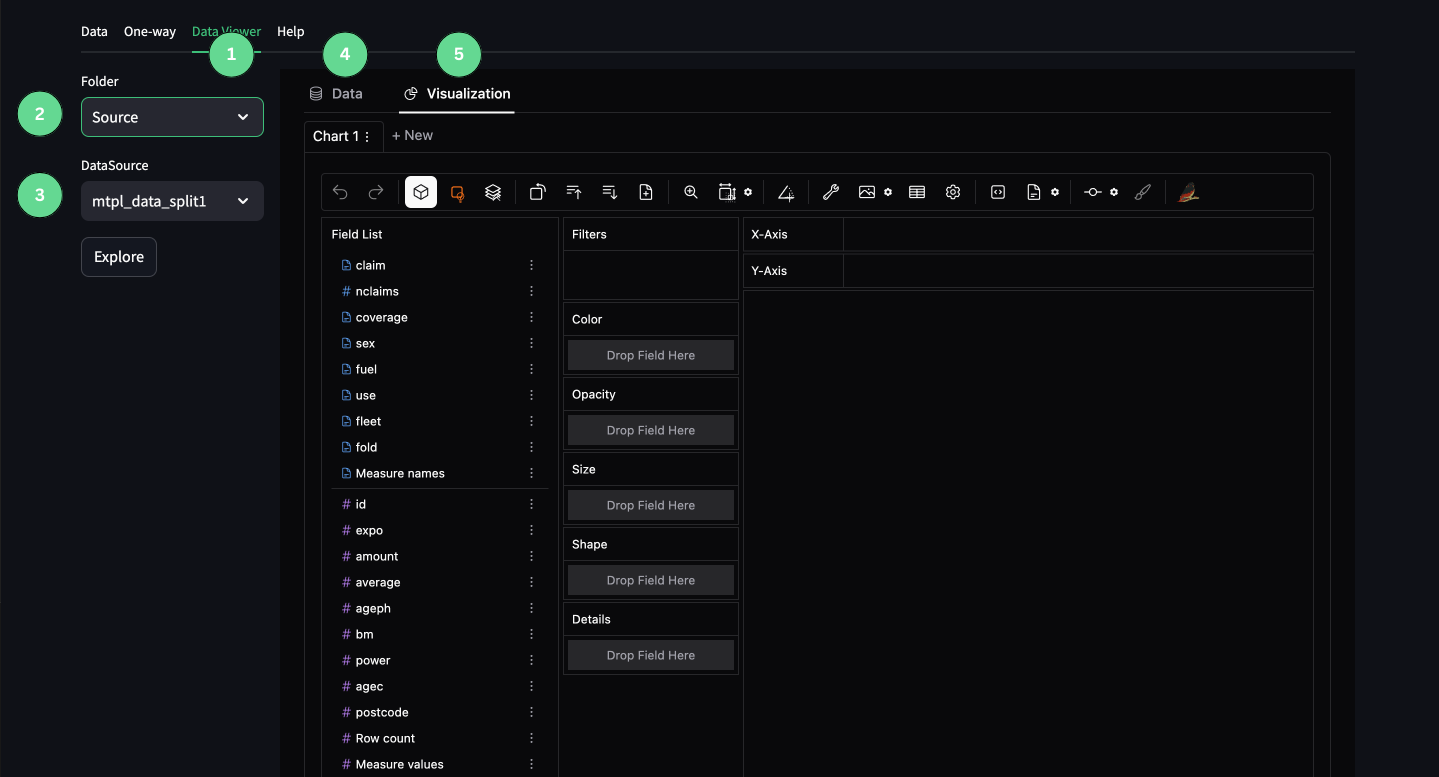
1. Data viewer tab
2. The Folder dropdown list where you can choose which folder they would like to choose a dataset from.
3. The Datasource dropdown list where you can choose which datasource you would like to build one-way visualisations from.
4. Data tab that opens the data profiler.
5. Visualization tab that opens the data visualisation tab.
## User Guide
For the data viewer we use the open source PyGWalker.
For more information on the library, please see the following: [https://docs.kanaries.net/pygwalker](https://docs.kanaries.net/pygwalker)
Please the below tutorial video on how to use the data viewer.
In the future we are playing to additional tutorials on how to use the dataviewer for actuarial/rating data analysis.
Watch this space.
 1. Data viewer tab
2. The Folder dropdown list where you can choose which folder they would like to choose a dataset from.
3. The Datasource dropdown list where you can choose which datasource you would like to build one-way visualisations from.
4. Data tab that opens the data profiler.
5. Visualization tab that opens the data visualisation tab.
## User Guide
For the data viewer we use the open source PyGWalker.
For more information on the library, please see the following: [https://docs.kanaries.net/pygwalker](https://docs.kanaries.net/pygwalker)
Please the below tutorial video on how to use the data viewer.
In the future we are playing to additional tutorials on how to use the dataviewer for actuarial/rating data analysis.
Watch this space.
1. Data viewer tab
2. The Folder dropdown list where you can choose which folder they would like to choose a dataset from.
3. The Datasource dropdown list where you can choose which datasource you would like to build one-way visualisations from.
4. Data tab that opens the data profiler.
5. Visualization tab that opens the data visualisation tab.
## User Guide
For the data viewer we use the open source PyGWalker.
For more information on the library, please see the following: [https://docs.kanaries.net/pygwalker](https://docs.kanaries.net/pygwalker)
Please the below tutorial video on how to use the data viewer.
In the future we are playing to additional tutorials on how to use the dataviewer for actuarial/rating data analysis.
Watch this space.